


A note on lower timeframe confirming price action…
Waiting for lower timeframe confirmation is our main tool to confirm strength within higher timeframe zones, and has really been the key to our trading success. It takes a little time to understand the subtle nuances, however, as each trade is never the same, but once you master the rhythm so to speak, you will be saved from countless unnecessary losing trades. The following is a list of what we look for:
- A break/retest of supply or demand dependent on which way you’re trading.
- A trendline break/retest.
- Buying/selling tails/wicks – essentially we look for a cluster of very obvious spikes off of lower timeframe support and resistance levels within the higher timeframe zone.
- Candlestick patterns. We tend to only stick with pin bars and engulfing bars as these have proven to be the most effective.
We search for lower timeframe confirmation between the M15 the H1 timeframes, since most of our higher-timeframe areas begin with the H4. Stops are usually placed 5-10 pips beyond confirming structures.
EUR/USD:
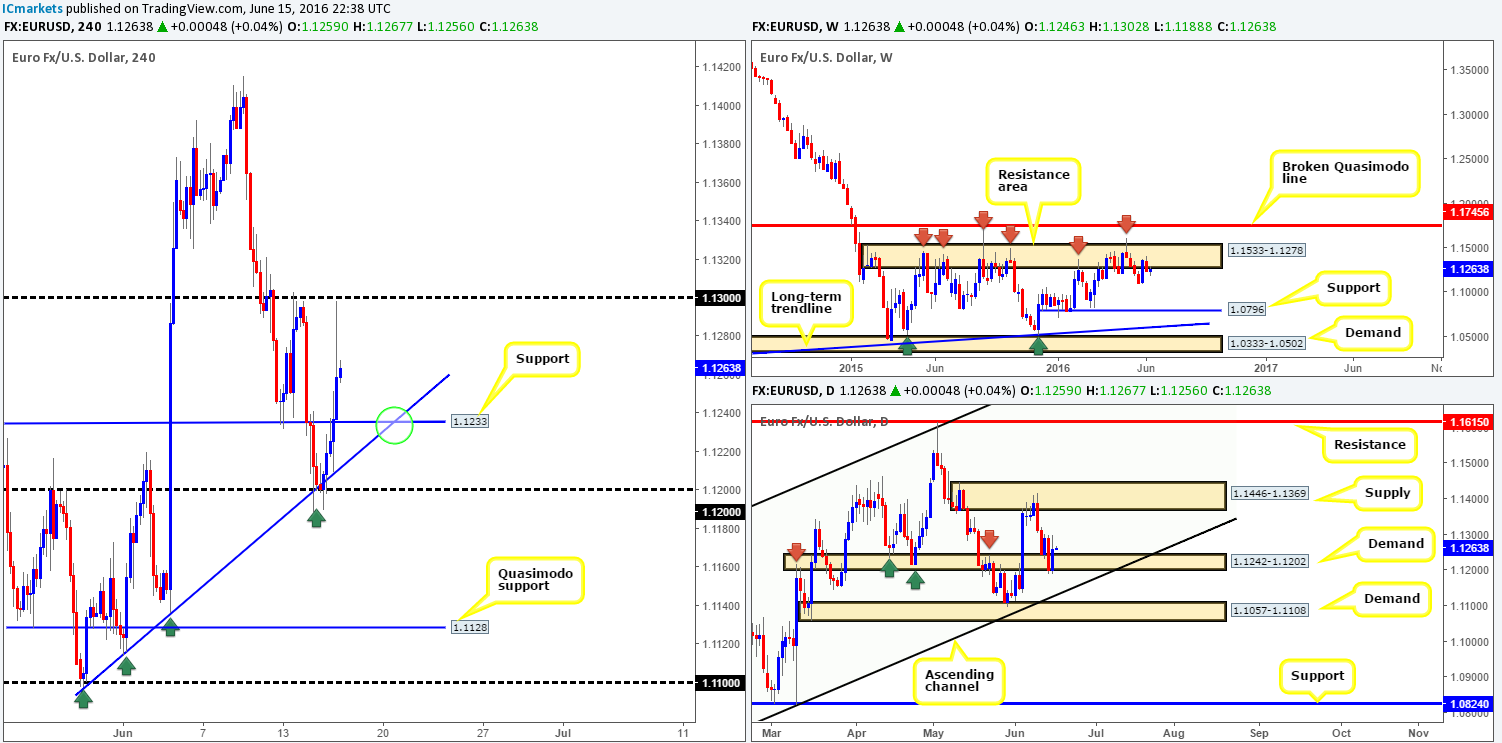
On the back of the Fed’s decision to leave interest rates unchanged yesterday, the EUR struck highs of 1.1298 before collapsing to the H4 mid-way support region 1.1250 by the day’s close. With the buyers and sellers still seen battling for position around the underside of a weekly resistance area at 1.1533-1.1278, and knowing that this zone has held price lower since May 2015, further downside is still highly likely in this market. The demand seen over on the daily chart at 1.1242-1.1202 was initially thought to have been weakened. Clearly, we wrong in this instance as the bulls bid this base nicely during yesterday’s session. In the event that the bulls remain steadfast, this unit could reach as high as daily supply coming in at 1.1446-1.1369.
Our suggestions: The converging H4 trendline taken from the low 1.1097 and H4 support at 1.1233 (green circle) could be a nice region to look for a bounce long today. However, we would be cautious here considering price is trading around the above said weekly resistance area.
Should the single currency close below 1.12, nevertheless, our team would shift stances and look to short this market, targeting the daily channel support line extended from the low 1.0516. As we mentioned in our previous report regarding a short from 1.12, two things would need to be seen before capital is put into this idea. Firstly, a retest of 1.12 as resistance, and secondly a lower timeframe sell signal following the retest (see the top of this report for ideas on pinning down lower timeframe setups).
Levels to watch/live orders:
- Buys: Flat (Stop loss: N/A).
- Sells: Watch for price to consume 1.12 and look to trade any retest seen thereafter (lower timeframe confirmation required).
GBP/USD:
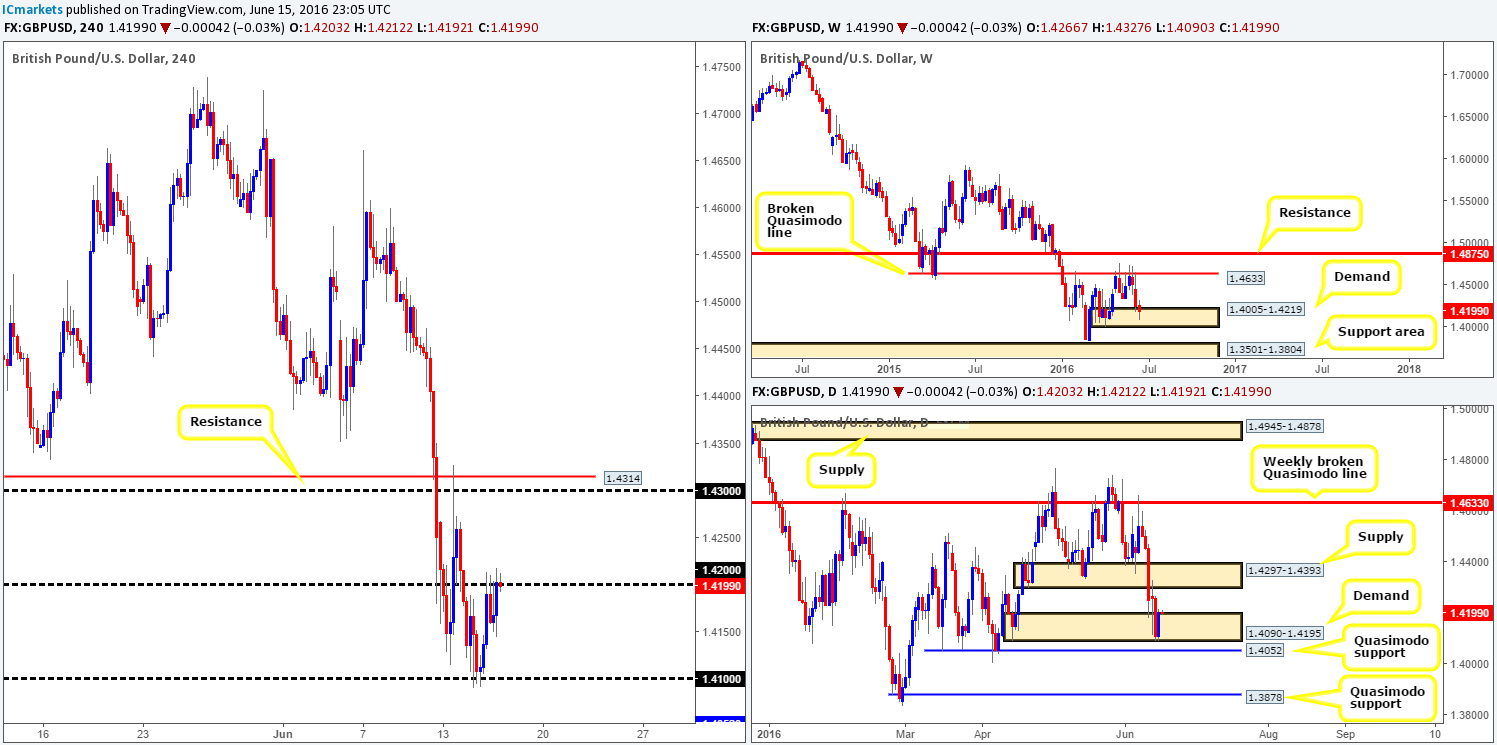
Favorable UK employment data saw this market bid going into the early hours of London trading yesterday. However, gains were short-lived and not really anything to get excited about, as price failed to break through the 1.42 barrier, which effectively capped price for the remainder of the day. On the docket today we have the BoE which is set to take the stage at midday GMT to discuss monetary policy, so do expect some volatility around that time!
From a technical standpoint, Weekly demand at 1.4005-1.4219 is beginning to show some life, whilst daily demand at 1.4090-1.4195 (positioned within the above said weekly demand) has also remained intact. The next upside target on the higher timeframes can be seen at daily supply drawn from 1.4297-1.4393.
Our suggestions: Although cable recovered modestly yesterday, there is, in our humble opinion, just too much at stake to consider a trade in this market right now. Not only is the ‘Brexit’ situation incredibly unpredictable, but with the BoE likely to shake things up further today, we believe the best position is to remain flat.
Be that as it may, if one believes that sterling will continue to advance from the higher timeframe demands (see above), we would advise waiting for 1.42 to be taken out and retested as support, since the path north appears free up to 1.43 (essentially the underside of the daily supply mentioned above at 1.4297-1.4393).
Levels to watch/live orders:
- Buys: Flat (Stop loss: N/A).
- Sells: Flat (Stop loss: N/A).
AUD/USD:
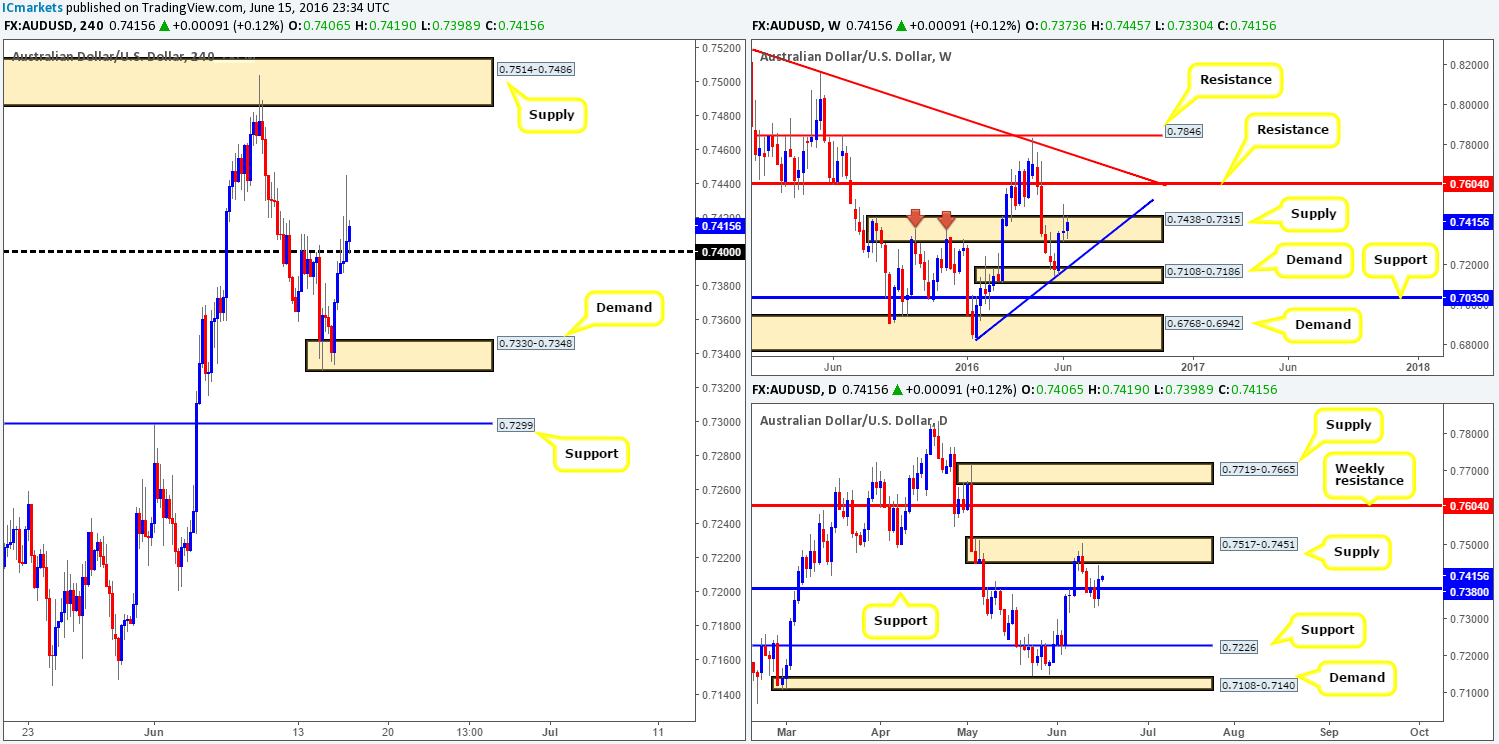
From the top this morning, the weekly chart shows that the bears are struggling to maintain a foothold within the current weekly supply base seen at 0.7438-0.7315. Should we see this week’s candle close above this barrier, it is very possible price will stretch out to reach for weekly resistance line penciled in at 0.7604. Turning our attention to the daily chart, the Aussie is, thanks to yesterday’s buying, now sandwiched between daily supply residing at 0.7517-0.7451 and daily support taken from 0.7380.
Over on the H4 chart, however, the commodity currency recently cut through the 0.74 line, which, as we write, looks to have already been retested as support and is holding firm. With Aussie employment data being released in a couple of hours and considering that weekly action is also trading from within supply (see above), we would be very careful buying from 0.74. Even with a break below 0.74, which would be considered in-line with weekly expectations, you only have twenty or so pips room to the downside until daily support at 0.7380!
Our suggestions: In the current picture, we feel trading this pair is a risky play. No matter which way one turns, higher timeframe obstacles are already in the action or seen within touching distance, so we have decided to place this pair on the back burner today and reassess going into tomorrow’s sessions.
Levels to watch/live orders:
- Buys: Flat (Stop loss: N/A).
- Sells: Flat (Stop loss: N/A).
USD/JPY:
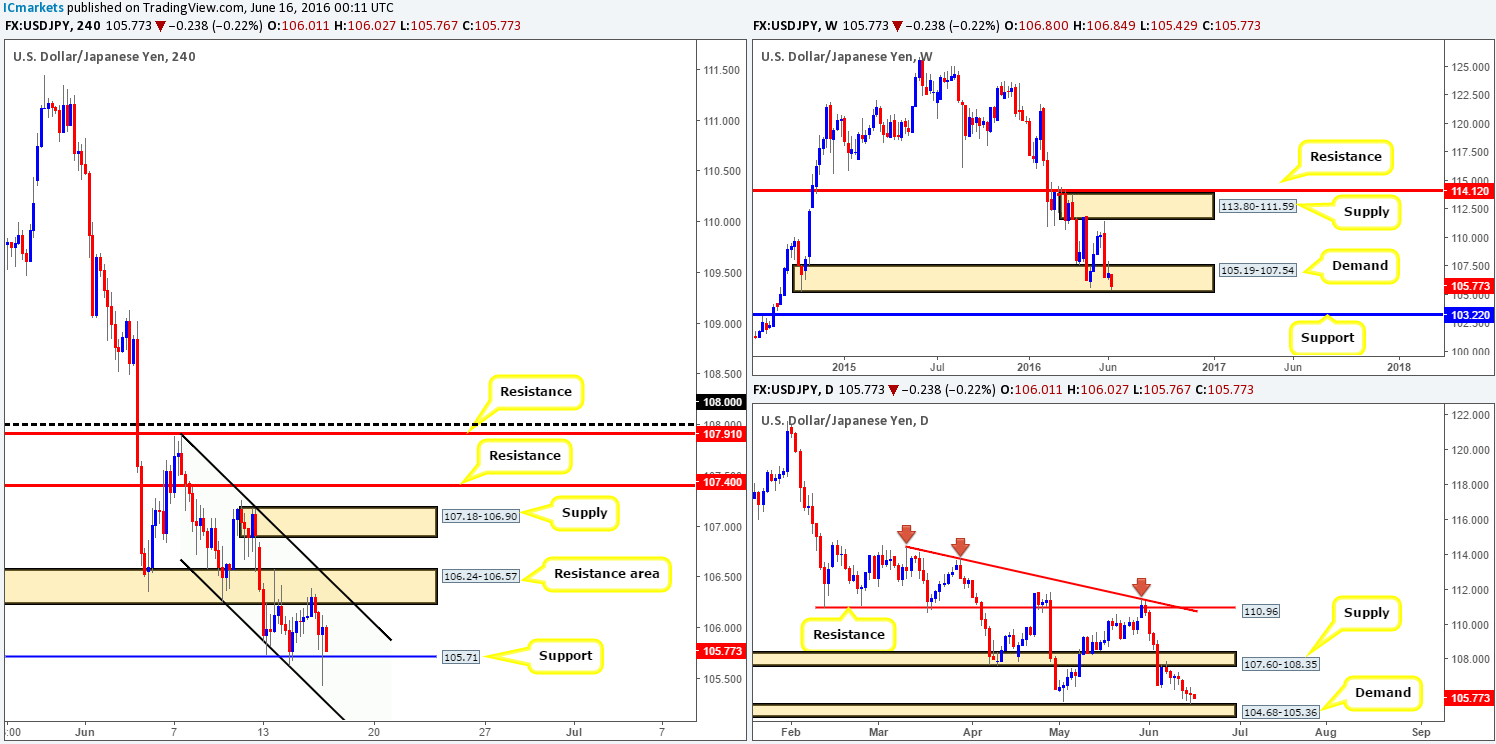
Despite this pair closing lower for the fourth consecutive day yesterday, H4 shows that price continues to respect the current H4 range (H4 resistance area at 106.24-106.57 [which coincides with H4 channel resistance taken from the high 107.90] and H4 support at 105.71). However, with the Nikkei finding H4 support from around the 15860 region, the USD/JPY pair may test the upper limits of this consolidation today. What is more, check out how close daily action came to testing daily demand seen at 104.68-105.36 (a mere seven pips), before printing an indecision candle. Alongside this, weekly price remains trading within the confines of weekly demand at 105.19-107.54. As you can see, price is struggling here at the moment as investors are favoring the safe-haven Yen over risker markets at this time!
Our suggestions: Consequent to the H4 chart still trading within in the above said range, our outlook remains the same as in our previous report… Despite the higher timeframes showing price trading from demands (see above), buying this pair is difficult. Not only is there the current H4 resistance area to deal with, but there’s also a H4 supply seen just above that at 107.18-106.90, and then on top of this a neighboring H4 resistance at 107.40 is seen. This – coupled with the strong downtrend in play makes it a very difficult market to go long in, no matter where higher timeframe price is positioned!
Therefore, our team will continue to sit on the sidelines for the time being and reassess the situation going into tomorrow’s sessions.
Levels to watch/live orders:
- Buys: Flat (Stop loss: N/A).
- Sells: Flat (Stop loss: N/A).
USD/CAD:
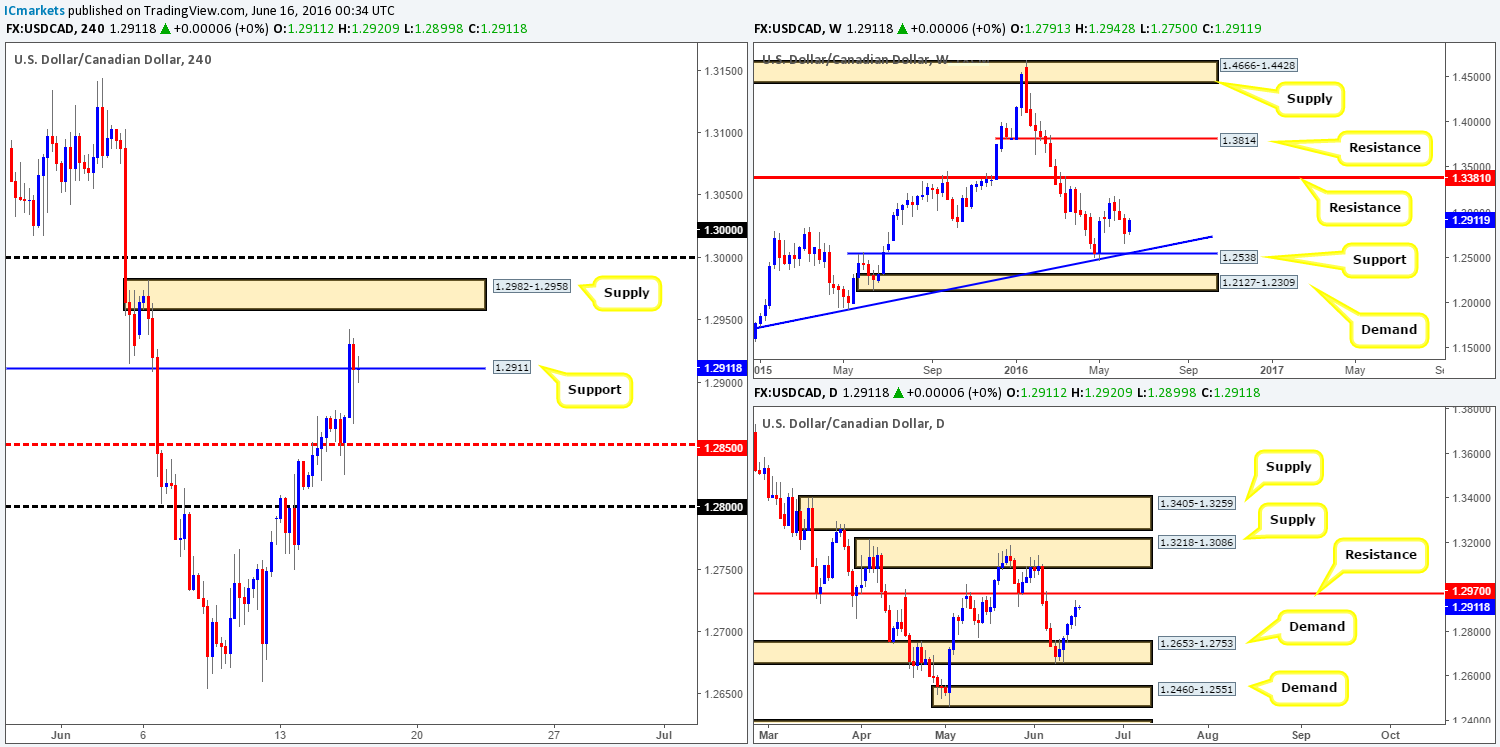
Looking over to the oil chart this morning we can see that price continued to trade south yesterday, managing to reach lows of 47.26. As most traders are already aware this is USD/CAD supportive, which consequently saw the pair close higher for the fourth consecutive day. For those who read our previous report (see link below) you may recall that we mentioned to keep an eye out for possible long opportunities from the H4 mid-way support at 1.2850. As we can see from the H4 chart, this worked out beautifully and went on to hit (target) H4 resistance (which is now support) at 1.2911. Well done to any of our readers who took advantage of this move!
Although price is currently trading from 1.2911 as support, caution is advised if you’re planning to go long from this barrier as just ahead sits a H4 supply at 1.2982-1.2958, which is bolstered by daily resistance at 1.2970. Therefore, our attention will mostly be driven toward shorting from the above said H4 supply barrier today. Before traders go placing pending short orders just below this supply, be warned that there is a large psychological number sitting just above at 1.30 that could potentially act as a magnet to price and fake the market above our sell zone! As such, we will only consider shorting from here if and only if lower timeframe confirming price action is seen. For ideas on how to confirm higher timeframe zones, please see the top of this report.
Levels to watch/live orders:
- Buys: Flat (Stop loss: N/A).
- Sells: 1.2982-1.2958 [Tentative – confirmation required] (Stop loss: dependent on where one confirms this area).
USD/CHF:
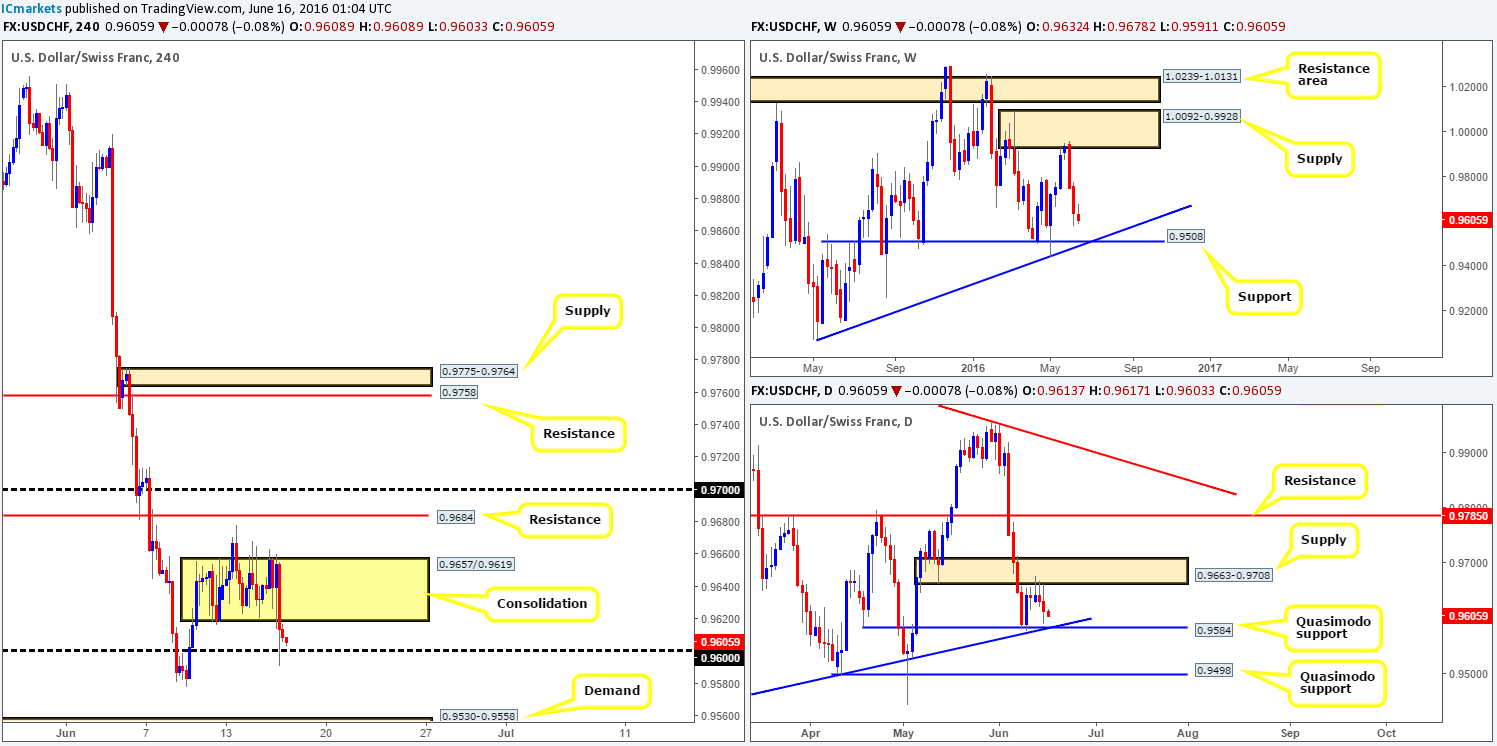
Beginning with a look at the weekly chart this morning, we can see that the bears continue to stamp down their authority on this pair with price now looking like it will connect with weekly support at 0.9508 sometime soon (coincides nicely with trendline confluence taken from the low 0.9078). Despite this, daily action, thanks to a recent sell-off from daily supply at 0.9663-0.9708, is now trading within touching distance of a daily Quasimodo support at 0.9584 that boasts daily trendline confluence from the low 0.9078.
Stepping over to the H4 chart, as expected, price did indeed breach the H4 range (0.9657/0.9619) and is now flirting with the 0.96 handle as we write. Shorting this market on the basis of the weekly picture (see above) is difficult in our opinion. Not only is there the 0.96 number to contend with but there is also the daily Quasimodo support lurking just below this at 0.9584! Furthermore, to top it off, there’s H4 demand sitting just below that at 0.9530-0.9558, which is positioned thirty or so pips above another daily Quasimodo support at 0.9498 (located a few pips below weekly support at 0.9508).
Our suggestions: Unfortunately, the downside shows too many obstacles on the H4 and daily charts for us to consider shorting in-line with weekly expectations. That being the case, our team has decided to remain flat going into today’s sessions.
Levels to watch/live orders:
- Buys: Flat (Stop loss: N/A).
- Sells: Flat (Stop loss: N/A).
DOW 30:
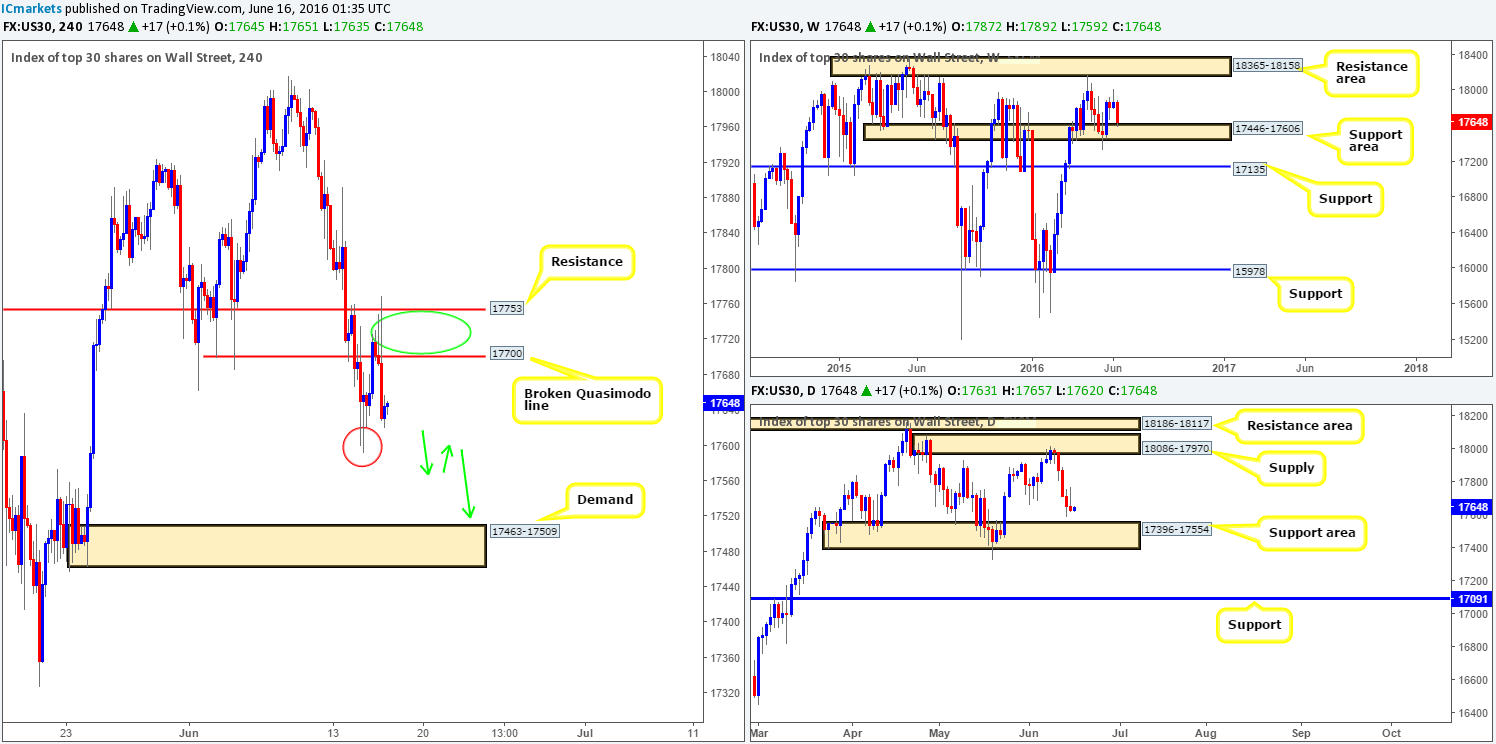
US stocks extended losses yesterday as price closed lower for the fourth consecutive day, following an aggressive retest of the 17753/17700 region seen marked with a green circle (H4 resistance/H4 Broken Quasimodo line). From the daily chart, we see very little stopping this index from driving further south to plug into bids around the daily support area at 17396-17554. However, up on the weekly chart, the DOW has already checked in with a weekly support area coming in at 17446-17606.
Our suggestions: By and large, we still feel that this market is set to drop lower despite the weekly support area now in view (see above). Initially we were looking to short from the above said H4 area at 17753/17700, but we unfortunately missed this move yesterday! Therefore, should price continue to sell-off (without retesting 17753/17700 again) from its current position, the only option we see would be to try and pin down a lower timeframe break and retest setup beyond Tuesday’s low 17592 (red circle) as per the green arrows, targeting H4 demand seen at 17463-17509 (positioned within the daily support area mentioned above at 17396-17554).
Levels to watch/live orders:
- Buys: Flat (Stop loss: N/A).
- Sells: 17753/17700 region [Tentative – confirmation required] (Stop loss: dependent on where one confirms this area). 17592 region [Tentative – confirmation required] (Stop loss: dependent on where one confirms this area).
GOLD:
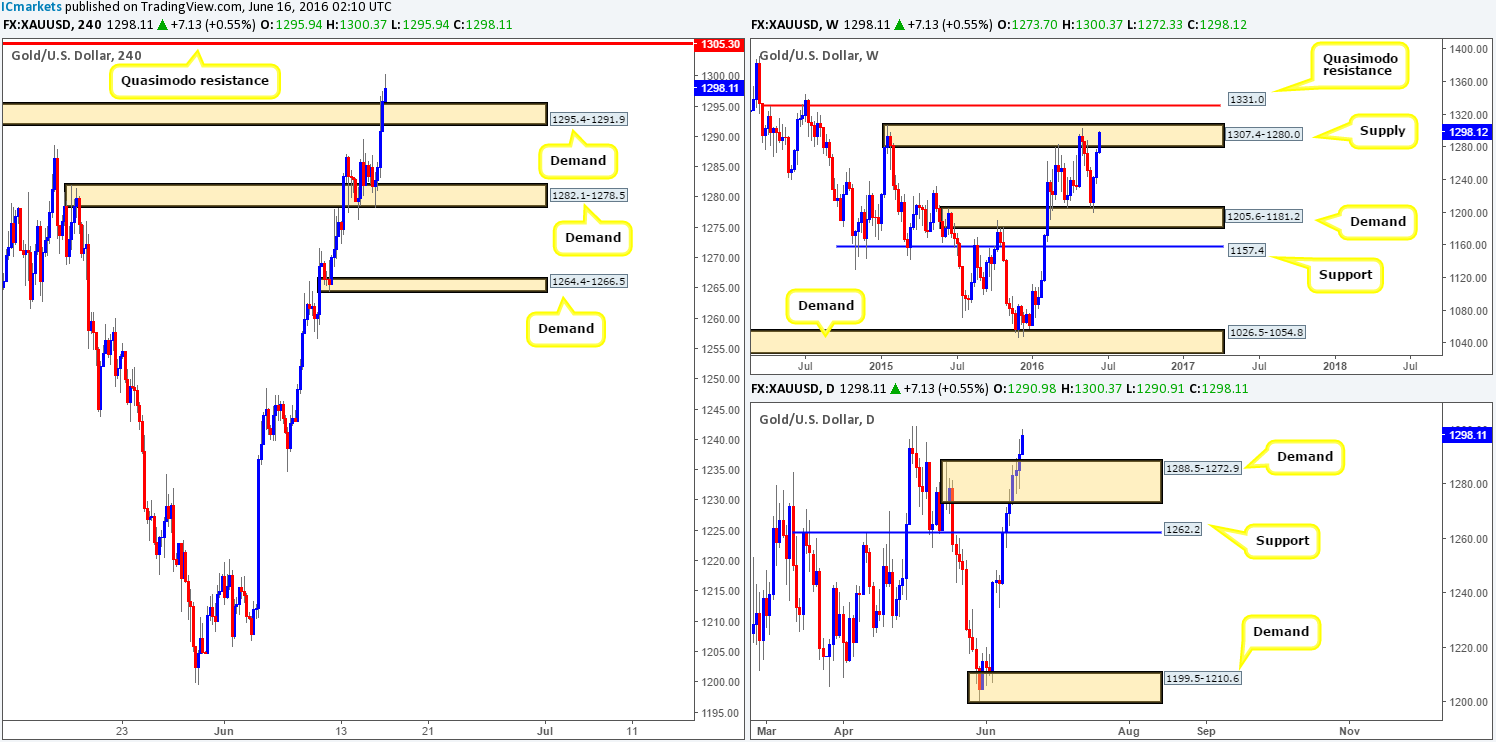
On the back of a weak dollar, the yellow metal was once again heavily bid higher yesterday! This, as you can see, drove price above H4 supply at 1295.4-1291.9 (now acting demand), and has likely opened the path north for further upside towards a H4 Quasimodo resistance line penciled in at 1305.3.This Quasimodo is, as far as we can see, the last barrier of defense within the current weekly supply area (1307.4-1280.0) to stop gold from rallying to the weekly Quasimodo resistance seen at 1331.0.
Our suggestions: Despite the bullish tone the shiny metal is presenting right now, we feel a decent bounce will be seen from the H4 Quasimodo resistance line mentioned above at 1305.3. What is more, in taking a short from this region, one can place their stops above weekly supply at 1307.4-1280.0! Therefore, our team has placed a pending sell order at 1305.0 with a stop set at 1309.0. The first take-profit target will be the H4 demand seen just below at 1295.4-1291.9 which is where we’ll also reduce risk to breakeven.
Levels to watch/live orders:
- Buys: Flat (Stop loss: N/A).
- Sells: 1305.0 [Pending order] (Stop loss: 1309.0).